Press Release: 2021-07-23
Massachusetts Weekly Unemployment Claimant Data 07-22-21
Massachusetts Weekly Unemployment Claimant Data 07-22-21:
FOR IMMEDIATE RELEASE: 7/22/2021
MASSACHUSETTS — Massachusetts Weekly Unemployment Claimant Data
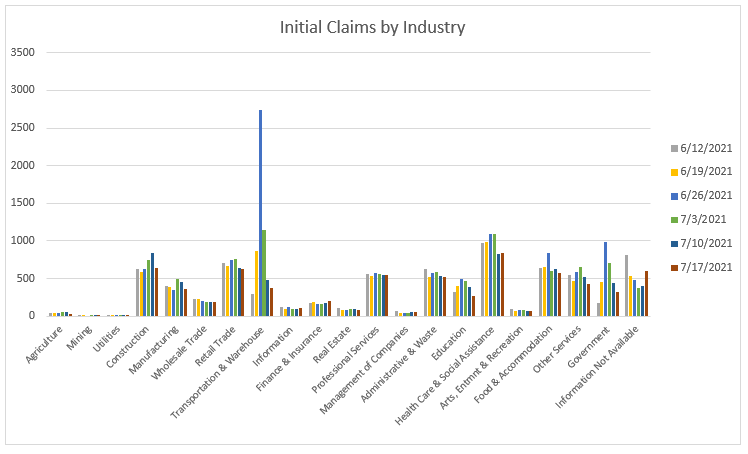
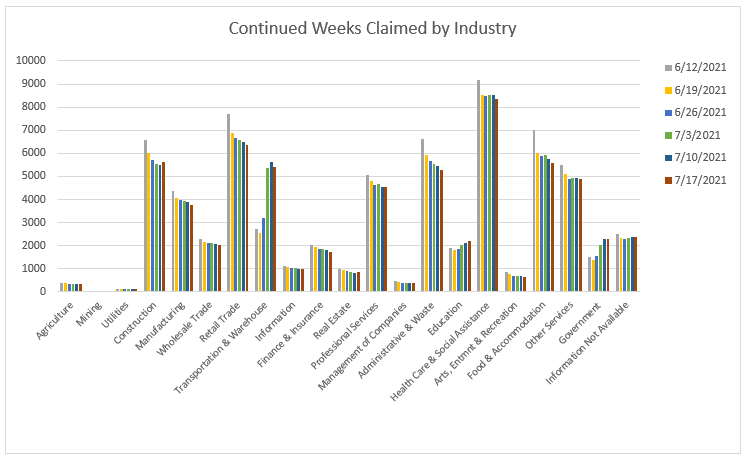
From July 11 to 17, Massachusetts had an estimated 6,833 individuals file an initial claim for regular Unemployment Insurance (UI), a decrease of 601 claims from the previous week. Decreases were widespread among all sectors with the largest decreases in initial claims filings in: Construction, down 197; Public Administration, down 125; Education, down 120; Transportation and Warehouse, down 97; and Manufacturing, down by 92 claims. Notable increase in initial claims filings was seen in Information Not Available (either lacking employer or industry information), up by 198 claims. (Please note that due to a system processing error, initial claims filings for regular UI for the current and prior week are estimated values and included here as reported to the Employment and Training Administration. The corrected values will be provided when they become available.) Continued weeks claimed for week ending July 17 decreased by 347 from the previous week to 66.951.
From July 11 to July 17, the Pandemic Unemployment Assistance (PUA) program had 1,510 initial claims filed, an increase of 236 claims from the previous week. PUA continued weeks claimed for week ending July 17 increased slightly to 199.890. an increase of 140 over the previous week.
The Pandemic Emergency Unemployment Compensation (PEUC), which was implemented on May 21, 2020, had 5,053 initial claims, down 96 and 188,819 continued weeks claimed up 1,054 for the week ending July 17. The increase was due primarily to EB triggering off and affected claimants were transferred to PEUC, if eligible, without interruption of benefits.
The federal/state Extended Benefits (EB) program, from July 11 to 17, had 283 initial claims filed and 1,275 continued weeks claimed.
Initial Claims Filed
Industry | Week Ending 7/10 | Week Ending 7/17 | Change | % Change |
Agriculture, Forestry, | 59 | 30 | -29 | -49.2% |
Mining | 2 | 4 | 2 | 100.0% |
Utilities | 12 | 15 | 3 | 25.0% |
Construction | 836 | 639 | -197 | -23.6% |
Manufacturing | 455 | 363 | -92 | -20.2% |
Wholesale Trade | 187 | 194 | 7 | 3.7% |
Retail Trade | 643 | 622 | -21 | -3.3% |
Transportation and | 474 | 377 | -97 | -20.5% |
Information | 100 | 105 | 5 | 5.0% |
Finance and Insurance | 174 | 203 | 29 | 16.7% |
Real Estate | 100 | 75 | -25 | -25.0% |
Professional and | 545 | 552 | 7 | 1.3% |
Management of Companies | 53 | 52 | -1 | -1.9% |
Administrative and | 536 | 525 | -11 | -2.1% |
Education | 385 | 265 | -120 | -31.2% |
Health Care and | 821 | 835 | 14 | 1.7% |
Arts, Entertainment and | 73 | 62 | -11 | -15.1% |
Food and Accommodation | 624 | 575 | -49 | -7.9% |
Other Services | 516 | 428 | -88 | -17.1% |
Public Administration | 441 | 316 | -125 | -28.3% |
Information Not Available | 398 | 596 | 198 | 49.7% |
Demographic Breakdowns
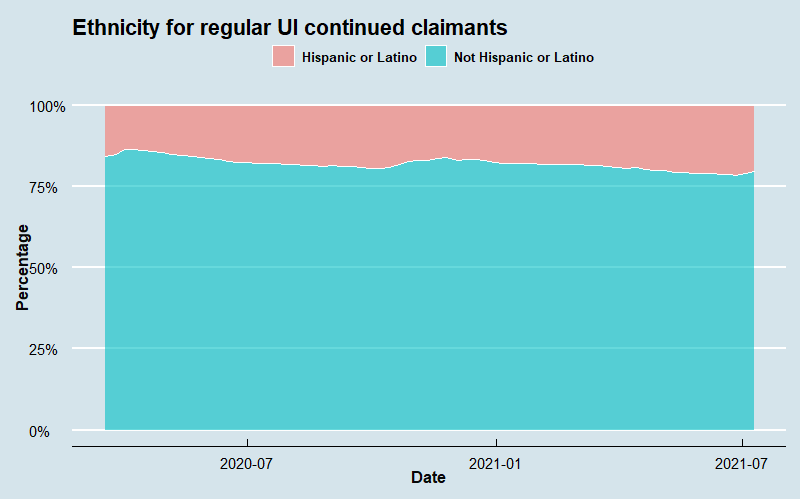
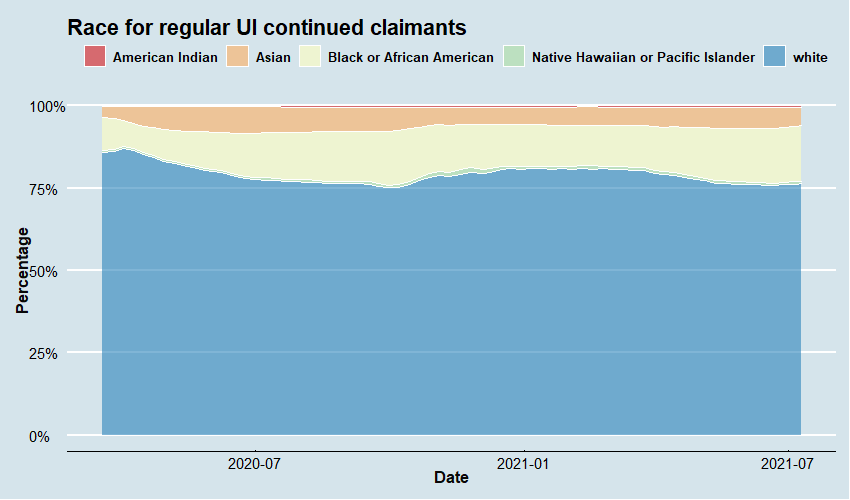
Below we present demographic statistics on ethnicity, gender, and race for all those claimants who filed for a continued week in the period prior to the above information. This is to say that because of the timing of data availability, the below statistics reflect continued weeks claimed in the week ending July 10th rather than the week ending July 17th. All demographic information is presented as a percentage of claimants who responded, excluding claimants for whom the information was not available.
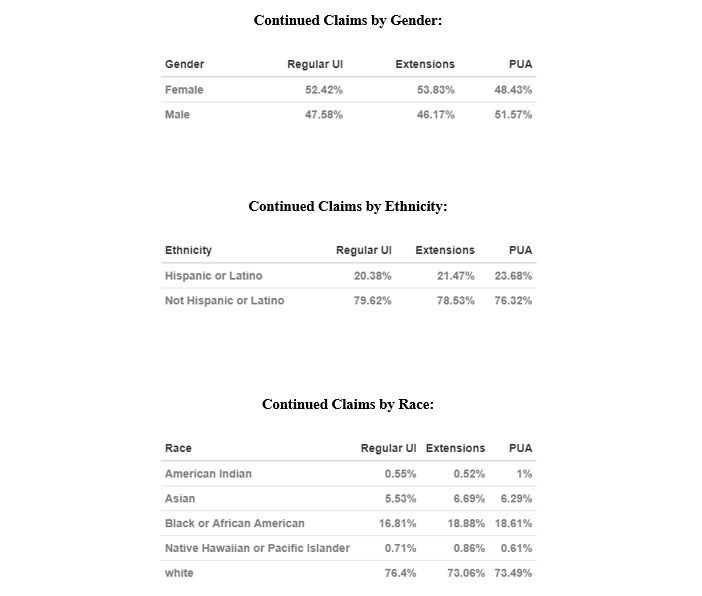
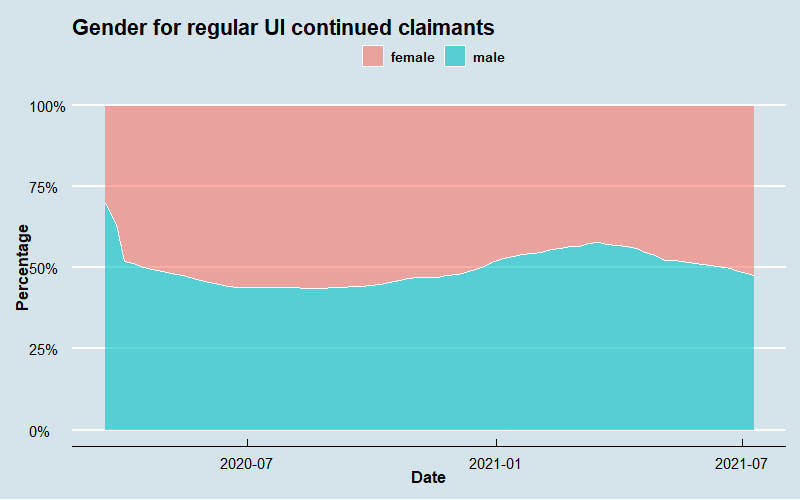
Regular UI Demographic Series
Here we present the breakdown by gender, ethnicity, and race of continued claims for Regular UI between March 8th, 2020 and July 10th, 2021:
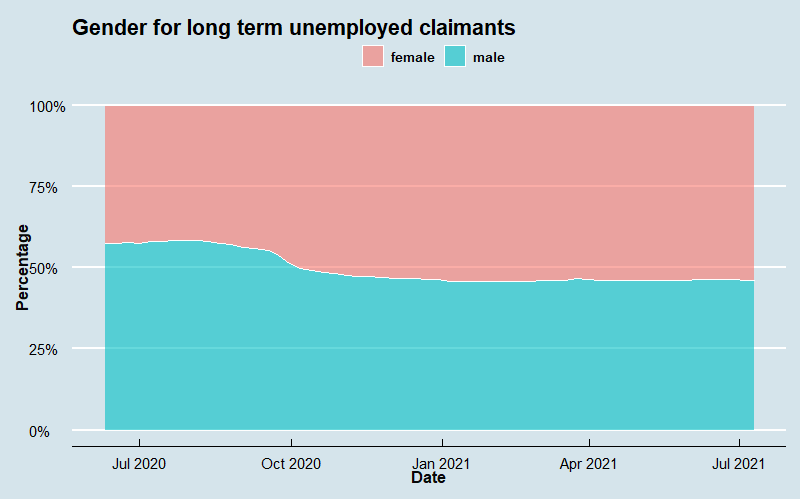
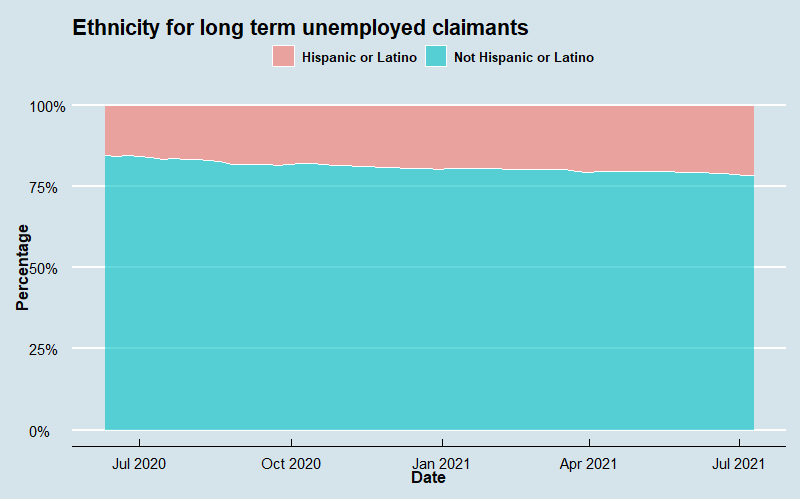
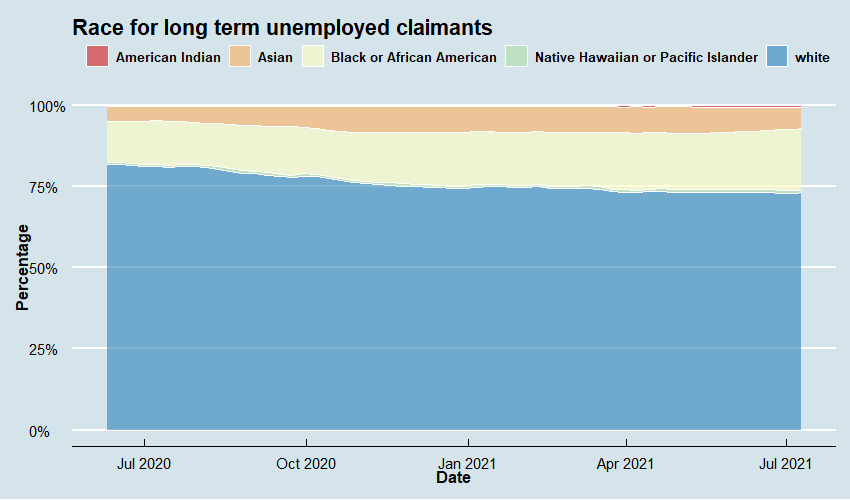
UI Extensions Demographic Series
Here we present the breakdown by gender, ethnicity, and race of continued claims for the PEUC and EB programs, which cover the long term unemployed, between May 31st, 2020 and July 10th, 2021:
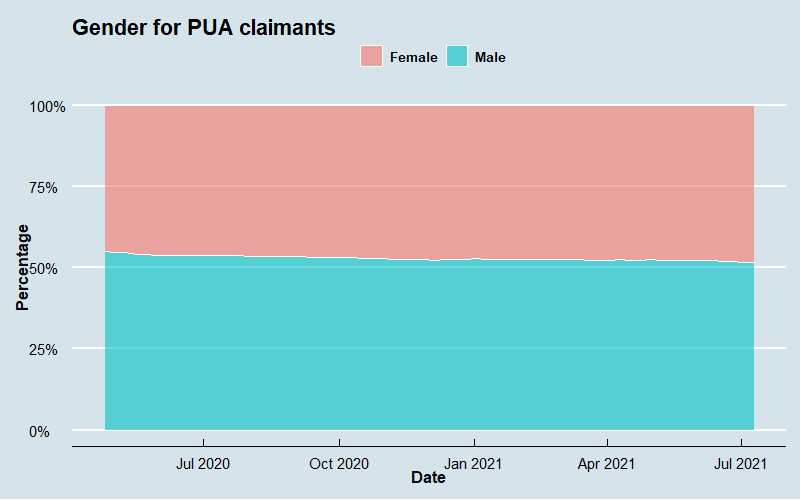
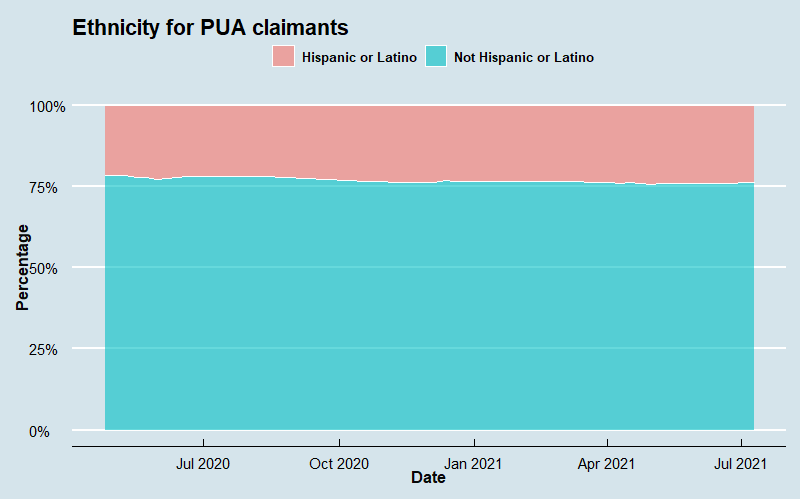
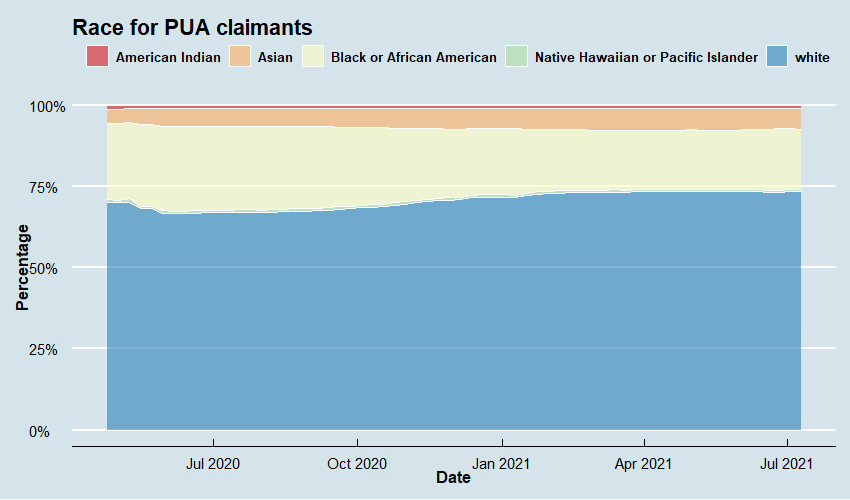
PUA Demographic Series
Here we present the breakdown by gender, ethnicity, and race of continued claims for the PUA program, which covers the self-employed and others not eligible for traditional unemployment insurance, between April 19th, 2020 and July 10th, 2021: