Press Release: 2022-01-21
Massachusetts Monthly Unemployment Claimant Data for the month ending January 8, 2022
Massachusetts Monthly Unemployment Claimant Data for the month ending January 8, 2022:
FOR IMMEDIATE RELEASE: 1/20/2022
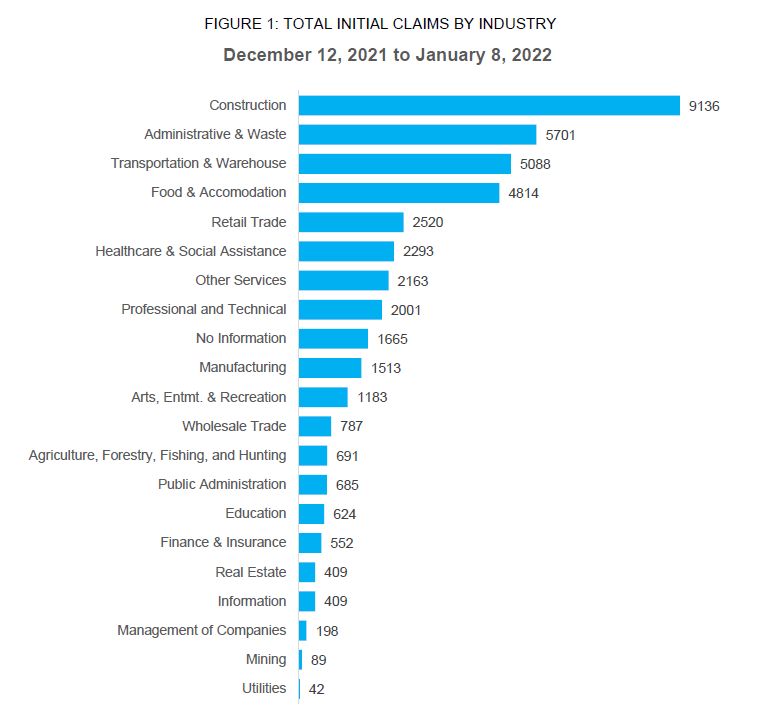
BOSTON, MA—January 20, 2022—Massachusetts had 42,277 individuals file an initial claim for regular Unemployment Insurance (UI) between December 12th, 2021, and January 8th, 2022, an increase of 13,357 claims from the previous four weeks aggregated. The largest increases were seen in: Transportation and Warehouse, up 3929 claims; Construction, up 3,271 claims; Food and Accommodation, up 2,502 claims; and Administrative and Waste, up 2,346 claims.
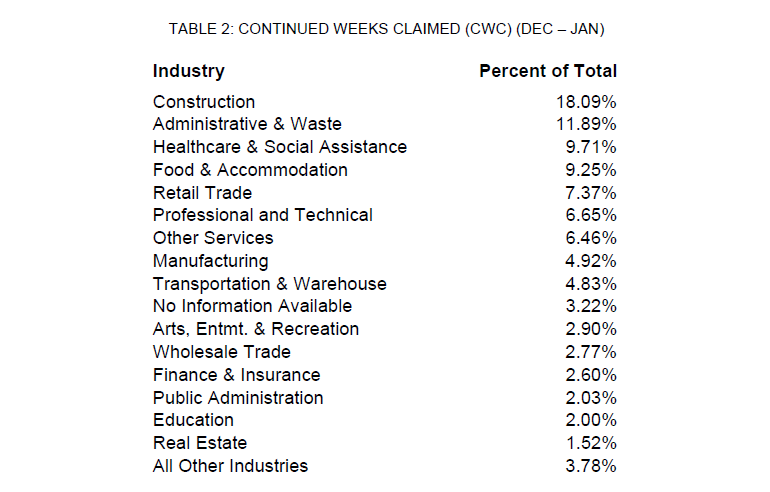
Continued weeks claimed increased by 38,387 from the previous months to 259,644 between December 12th and January 8th. The largest increases were seen in Construction, up 16,849 claims; Administrative and Waste, up 10,553 claims; and Food and Accommodation, up 5,430 claims.
The Pandemic Unemployment Assistance (PUA) program, which was implemented on May 21,2020, had 2 initial claims filed and 3,110 continued weeks claimed, an increase of 45 continued weeks claims from the four weeks prior. The PUA benefits program ended on September 4, 2021.
The Pandemic Emergency Unemployment Compensation (PEUC), which was implemented on May 21, 2020, had 58 initial claims. Continued weeks claimed decreased by 210 to 809. The PEUC program ended on September 4, 2021.
The federal/state Extended Benefits (EB) program which triggered off on July 17 had no initial or continued weeks claims since week ending October 9th, 2021. There was a no change in initial claims from the previous month while total continued weeks claimed decreased by 19 claims.
The Federal Pandemic Unemployment Compensation (FPUC) which was implemented on May 21,2020 and provided an additional $300 a week on top of regular benefits also ended on September 4, 2021.
NOTE: Following the termination of pandemic assistance (PUA, FPUC, PEUC) and long-term benefit (EB) programs, claims reports will be published in conjunction with the Massachusetts Unemployment and Job Estimates monthly releases, at mass.gov/lwd in the News and Updates section. Weekly UI claims reporting can be found at https://www.dol.gov/ui/data.pdf.
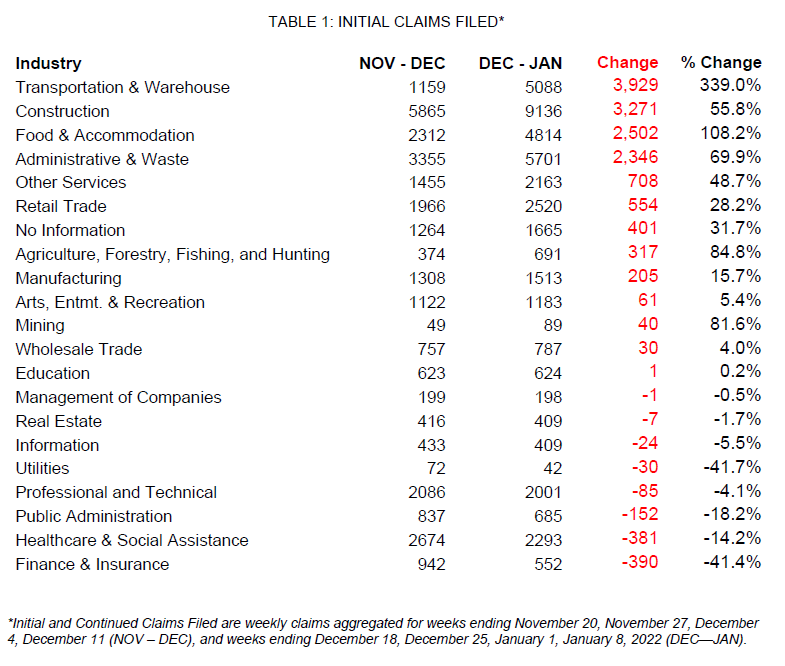
Transportation and Warehousing saw the greatest increase in initial claims over month while Finance and Insurance saw the largest decline. The largest increases in the top four industries listed in Table 1 and Figure 1 took place after Christmas (week ending December 25th, 2021), an indication that the increases are likely due to the seasonality of the holidays and cold weather and/or the impact of rising COVID-19 cases on business. These industries include Administrative and Waste, Transportation and Warehouse, and Food Accommodation led by Construction with the almost double their number of total claims among those four weeks. The spike in these industries, specifically Transportation and Warehouse, is consistent with seasonal trends in previous years during the same time.
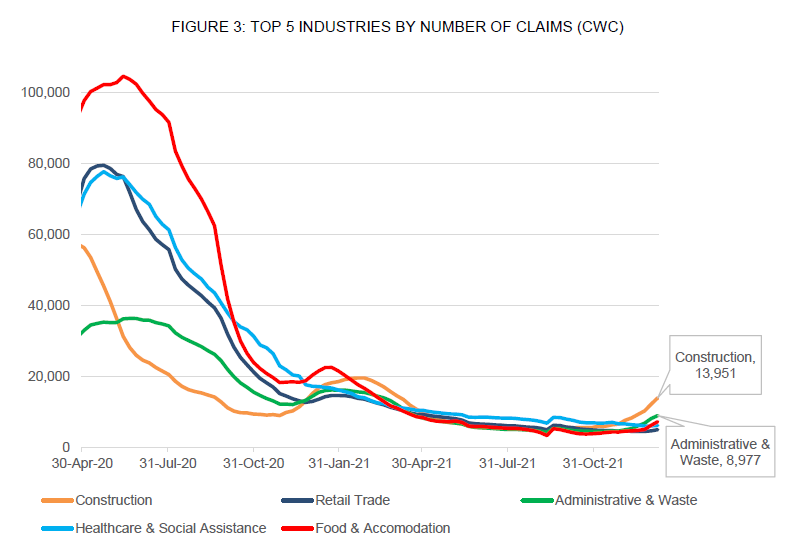
The industries with the highest number of continued claims include Construction, Administrative and Waste, Health Care and Social Assistance, Food and Accommodation, and Retail Trade. Construction, Transportation and Warehousing, and Food and Accommodation industries saw the greatest increases in continued claims, especially after the New Year for the week ending January 8, 2022. The seasonal cause as noted for initial claims is applicable for continued claims as well. Notably, Health Care and Social Assistance saw a significant decline over the month—with the lowest number of continued claims in this industry occurring during the week ending December 25th.
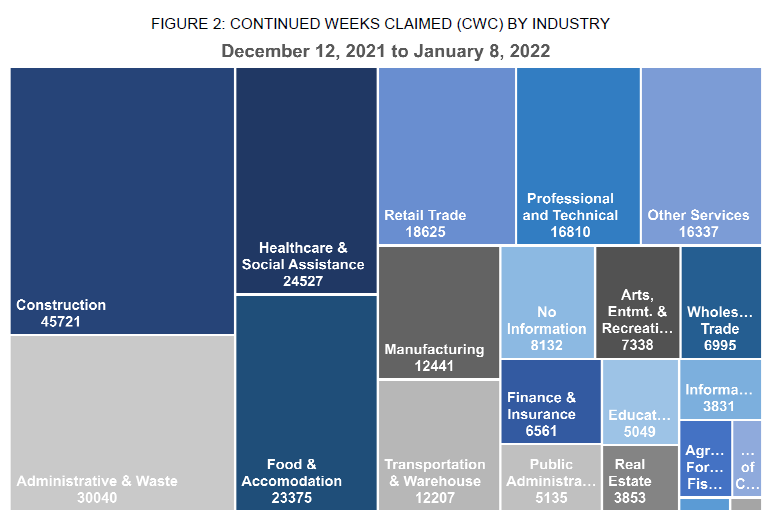
At the peak of the pandemic, the industries with the highest of continued claims were Construction, Retail Trade, Food and Accommodation, Health Care and Social Assistance, and Other Services. The steady decline in continued claims could be due to the unemployed reaching their 26-week benefit limit or switching to different sectors. Most continued claims over the month of December to January came from the Construction and Administrative and Waste sectors, reaching almost 14,000 and 9,000, respectively, for the week ending January 8, 2022.
DEMOGRAPHIC BREAKDOWNS
Below we present demographic statistics on ethnicity, gender, and race for all those claimants who filed for a continued week in the period prior to the above information. Because of the timing of data availability, the below statistics reflect continued weeks claimed in the week ending January 1st, 2022, rather than the week ending January 8th. All demographic information is presented as a percentage of claimants who responded, excluding claimants for whom the information was not available.
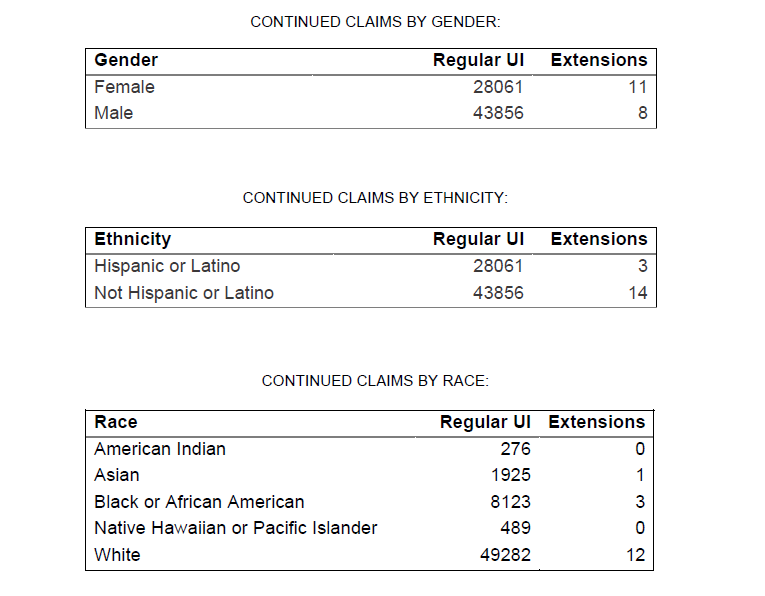
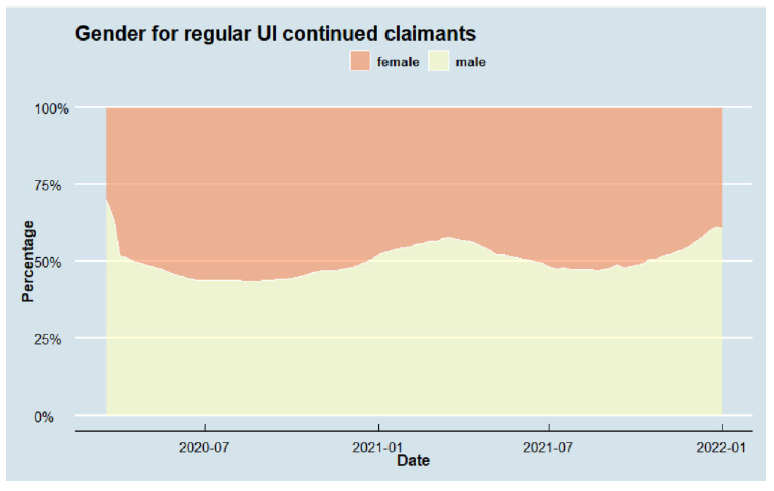
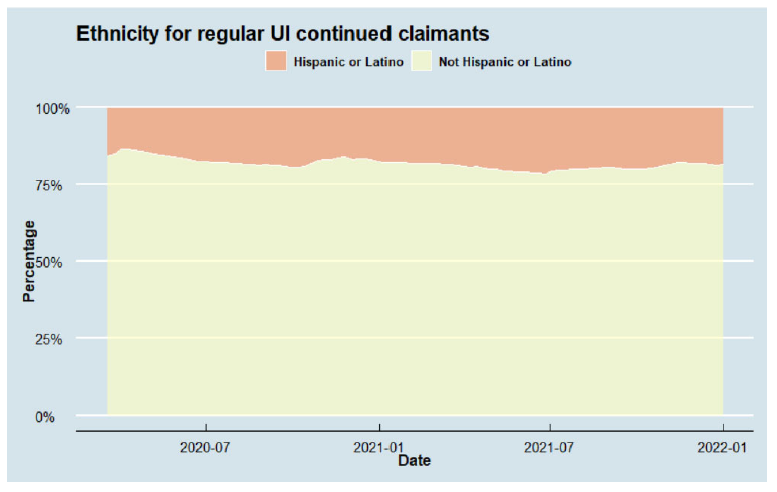
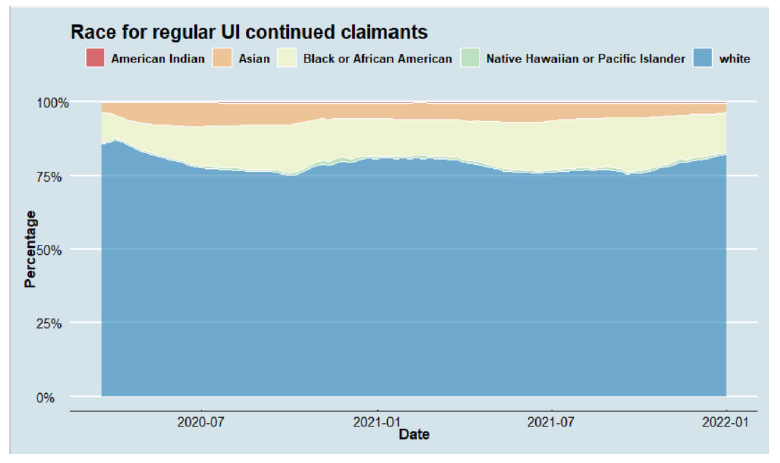
REGULAR UI DEMOGRAPHIC FIGURES
Here we present the breakdown by gender, ethnicity, and race of continued claims for Regular UI between March 8th, 2020 and January 1st, 2022:
UI EXTENSIONS DEMOGRAPHIC FIGURES
This series is discontinued because the weekly sample sizes of continued claims for the PEUC and EB programs, which covered the long term unemployed, are too small to be accurately represented graphically.